Market Outlook
May 30, 2017
Market Cues
Domestic Indices
Chg (%)
(Pts)
(Close)
Indian markets are likely to open on Flat to negative note tracking the SGX Nifty and
BSE Sensex
0.3
81
31,109
Global markets.
Nifty
0.1
10
9,605
European stocks kicked off the week in slightly negative territory on Monday, with
Mid Cap
(1.0)
(150)
14,370
market holidays in the U.S. and U.K. denting trading volumes.
Small Cap
(1.5)
(231)
14,855
Indian Indices reached fresh record highs on Monday before giving up most gains to
Bankex
(0.9)
(249)
26,247
the end the session largely unchanged, hit by muted global cues as U.S. President
Donald Trump refused to endorse the Paris global climate change accord and North
Global Indices
Chg (%)
(Pts)
(Close)
Korea fired another missile off its east coast, the latest in a fast-paced series of
missile tests defying world pressure and threats of more sanctions
Dow Jones
(0.0)
1(3)
21,080
Nasdaq
0.1
55
6,210
The benchmark Sensex closed up 0.26% at a new peak of 31,109.The broader 50-
FTSE
0.4
30
7,548
share NSE Nifty settled higher 0.10%, at 9,605, a new peak, beating its previous
Nikkei
(0.5)
(105)
19,578
record closing of 9,595 recorded on Friday.
Hang Seng
0.2
262
25,702
News Analysis
Shanghai Com
0.1
2
3,110
L&T Q4FY17 profit rises 29.5% to `3,025cr
Detailed analysis on Pg2
Advances / Declines
BSE
NSE
Investor’s Ready Reckoner
Advances
1,865
1,462
Key Domestic & Global Indicators
Declines
1,845
1,224
Stock Watch: Latest investment recommendations on 150+ stocks
Unchanged
163
71
Refer Pg6 onwards
Volumes (` Cr)
Top Picks
CMP
Target
Upside
BSE
3,827
Company
Sector
Rating
(`)
(`)
(%)
NSE
26,025
Blue Star
Capital Goods
Buy
635
760
19.6
Dewan Housing Fin. Financials
Buy
411
520
26.5
Mahindra Lifespace Real Estate
Buy
421
522
23.9
#Net Inflows (` Cr)
Net
Mtd
Ytd
Navkar Corporation Others
Buy
210
265
26.1
FII
(5(316)
10,056
52,068
KEI Industries
Capital Goods
Accumulate
213
239
11.9
MFs
8288
7,739
28,421
More Top Picks on Pg4
Key Upcoming Events
Top Gainers
Price (`)
Chg (%)
Previous
Consensus
Date
Region
Event Description
Pcjeweller
514
14.2
Reading
Expectations
May 30, 2017 Euro Zone Euro-Zone Consumer Confidence
(3.30)
(3.30)
Tatacomm
705
7.5
May 30, 2017 Germany Unemployment change (000's)
(15.00)
(14.00)
M&Mfin
327
4.5
May 31, 2017 US
Consumer Confidence
120.30
119.85
Escorts
672
4.5
May 31, 2017 China
PMI Manufacturing
51.20
51.00
Divislab
570
4.2
Jun 01, 2017 UK
PMI Manufacturing
57.30
56.50
Jun 01, 2017 US
Initial Jobless claims
234.00
239.00
More Events on Pg5
Top Losers
Price (`)
Chg (%)
Rcom
221
(20.5)
Cgpower
79
(15.5)
Jpassociat
11
(12.8)
Techm
379
(11.7)
Sunpharma
503
(11.6)
#As on 29th May 2017
Market Outlook
May 30, 2017
News Analysis
L&T Q4FY17 profit rises 29.5% to `3,025cr
Engineering and infrastructure giant Larsen & Toubro Ltd (L&T) has beaten market
expectation with a 29.5% growth in consolidated net profit for the Q4FY17, at
₹3,025cr compared with ₹2,335cr for the corresponding quarter of the previous
year.
Analysts polled by Thomson Reuters and Bloomberg had expected a consolidated
net profit of ₹2,592cr and ₹2,650cr, respectively.
The Group’s revenue at consolidated level for the quarter increased by 12% to
₹36,828cr. The revenue for FY-17 has registered 8 per cent growth reaching
₹1,10,011cr, while the net profit for the year grew 43% to ₹6,041cr compared
with ₹4,233cr in FY-16.
The many orders have been continuously postponed from quarter to quarter. L&T
has even removed ₹18,000cr worth orders from the backlog as there was zero
movement on those orders, emphasizing that the order book that company reports
consist only of executable orders it won orders worth `47,289cr in the Q4FY17, up
9.6% from a year earlier. International orders, at `9,044 cr, made up 19% of the
total order inflow.
The consolidated order book stood at `2.61 trillion as of 31 March, an increase of
5% from a year earlier.
Economic and Political News
SEBI looks to tighten the screws on P-Notes
World Bank says India will grow 7.2% in FY18, GST will deliver substantial
gains
SEBI proposes to levy $1,000 fee on each P-Note issuance, bar speculative
issuance
With lens on `5 lakh crore of loans, government turns focus on 50 top
stressed accounts
Corporate News
Team Lease to buy 30% stake in Freshersworld
R Com shares, bond continue to tumble amid debt concerns
IDBI Bank mulls action under bankruptcy code in 10 cases
Sun Pharma expects FY18 to be challenging year, hints at a 'single-digit
decline'
Market Outlook
May 30, 2017
Quarterly Bloomberg Brokers Consensus Estimate
Hindalco Industries Ltd - May 30, 2017
Particulars ( ` cr)
4QFY17E
4QFY16
y-o-y (%)
3QFY17
q-o-q (%)
Net sales
10,658
8,543
24.8
9,226
15.5
EBITDA
1,410
1,166
20.9
1,185
19.0
EBITDA margin (%)
13.2
13.7
12.8
Net profit
479
356
34.3
321
49.3
Mahindra & Mahindra Ltd - May 30, 2017
Particulars ( ` cr)
4QFY17E
4QFY16
y-o-y (%)
3QFY17
q-o-q (%)
Net sales
10,518
10,666
(1.4)
10,860
(3.1)
EBITDA
1,210
1,049
15.3
1,299
(6.9)
EBITDA margin (%)
11.5
9.8
12.0
Net profit
635
584
8.8
1,349
(52.9)
United Spirits Ltd - May 30, 2017
Particulars ( ` cr)
4QFY17E
4QFY16
y-o-y (%)
3QFY17
q-o-q (%)
Net sales
2,238
2,284
(2.0)
2,484
(9.9)
EBITDA
208
91
128.2
294
(29.2)
EBITDA margin (%)
9.3
4.0
11.8
Net profit
81
(9)
0.0
148
(45.0)
Rural Electrification Corp Ltd - May 30, 2017
Particulars ( ` cr)
4QFY17E
4QFY16
y-o-y (%)
3QFY17
q-o-q (%)
Net sales
2,590
6,064
(57.3)
5,646
(54.1)
EBITDA
2,570
5,507
(53.3)
5,537
(53.6)
EBITDA margin (%)
99.2
90.8
98.1
Net profit
1,631
1,160
40.6
1,754
(7.0)
Steel Authority of India Ltd - May 30, 2017
Particulars ( ` cr)
4QFY17E
4QFY16
y-o-y (%)
3QFY17
q-o-q (%)
Net sales
12,939
11,212
15.4
11,169
15.8
EBITDA
75
(1,124)
0.0
(43)
0.0
EBITDA margin (%)
0.6
-10.0
-0.4
Net profit
(873)
(1,231)
0.0
(795)
0.0
Tata Global Beverages Ltd Consol - May 30, 2017
Particulars ( ` cr)
4QFY17E
4QFY16 y-o-y (%)
3QFY17
q-o-q (%)
Net sales
2,012
1,928
4.4
1,718
17.1
EBITDA
196
166
18.0
184
6.5
EBITDA margin (%)
9.7
8.6
10.7
Net profit
103
107
(3.5)
160
(35.7)
Market Outlook
May 30, 2017
Top Picks ★★★★★
Market Cap
CMP
Target
Upside
Company
Rationale
(` Cr)
(`)
(`)
(%)
Strong growth in domestic business due to its leadership
in acute therapeutic segment. Alkem expects to launch
Alkem Laboratories
21,763
1,820
2,257
24.0
more products in USA, which bodes for its international
business.
We expect the company would report strong profitability
Asian Granito
1,097
365
405
11.1
owing to better product mix, higher B2C sales and
amalgamation synergy..
Favourable outlook for the AC industry to augur well for
Cooling products business which is out pacing the market
Blue Star
6,075
635
760
19.6
growth. EMPPAC division's profitability to improve once
operating environment turns around..
With a focus on the low and medium income (LMI)
consumer segment, the company has increased its
Dewan Housing Finance
12,877
411
520
26.5
presence in tier-II & III cities where the growth opportunity
is immense.
Strong loan growth backed by diversified loan portfolio
and adequate CAR. ROE & ROA likely to remain decent
Equitas Holdings
5,050
149
235
57.3
as risk of dilution remains low. Attractive valuations
considering growth.
Economic recovery to have favourable impact on
advertising & circulation revenue growth. Further, the
Jagran Prakashan
5,749
176
225
27.9
acquisition of a radio business (Radio City) would also
boost the company's revenue growth.
High order book execution in EPC segment, rising B2C
KEI Industries
1,657
213
239
11.9
sales and higher exports to boost the revenues and
profitability
Speedier execution and speedier sales, strong revenue
Mahindra Lifespace
2,163
421
522
23.9
visibilty in short-to-long run, attractive valuations
Massive capacity expansion along with rail advantage at
Navkar Corporation
2,998
210
265
26.1
ICD as well CFS augurs well for the company
Market leadership in Hindi news genre and no.
2
viewership ranking in English news genre, exit from the
TV Today Network
1,570
263
344
30.7
radio business, and anticipated growth in ad spends by
corporates to benefit the stock.
Source: Company, Angel Research
Market Outlook
May 30, 2017
Key Upcoming Events
Global economic events release calendar
Bloomberg Data
Date
Time
Country
Event Description
Unit
Period
Last Reported
Estimated
May 30, 2017
2:30 PM
Euro Zone
Euro-Zone Consumer Confidence
Value
May F
(3.30)
(3.30)
7:30 PM
US
Consumer Confidence
S.A./ 1985=100
May
120.30
119.80
May 31, 2017
6:30 AM
China
PMI Manufacturing
Value
May
51.20
51.00
1:25 PM
Germany
Unemployment change (000's)
Thousands
May
(15.00)
(14.50)
Jun 01, 2017
6:00 PM
US
Initial Jobless claims
Thousands
May 27
234.00
238.50
6:00 PM
US
Change in Nonfarm payrolls
Thousands
May
211.00
185.00
1:25 PM
Germany
PMI Manufacturing
Value
May F
59.40
59.40
Jun 02, 2017
2:00 PM
UK
PMI Manufacturing
Value
May
57.30
56.50
6:00 PM
US
Unnemployment rate
%
May
4.40
4.40
Jun 06, 2017
1:25 PM
Germany
PMI Services
Value
May F
55.20
Jun 07, 2017
2:30 PM
Euro Zone
Euro-Zone GDP s.a. (QoQ)
% Change
1Q F
0.50
2:30 PM
India
RBI Reverse Repo rate
%
Jun 7
6.00
6.00
2:30 PM
India
RBI Repo rate
%
Jun 7
6.25
6.25
2:30 PM
India
RBI Cash Reserve ratio
%
Jun 7
4.00
4.00
Jun 08, 2017
China
Exports YoY%
% Change
May
8.00
5:15 PM
Euro Zone
ECB announces interest rates
%
Jun 8
-
Jun 09, 2017
India
Imports YoY%
% Change
May
49.10
2:00 PM
UK
Industrial Production (YoY)
% Change
Apr
1.40
India
Exports YoY%
% Change
May
19.80
7:00 AM
China
Consumer Price Index (YoY)
% Change
May
1.20
1.40
Jun 12, 2017
5:30 PM
India
Industrial Production YoY
% Change
Apr
2.70
Jun 13, 2017
2:00 PM
UK
CPI (YoY)
% Change
May
2.70
US
Producer Price Index (mom)
% Change
May
0.60
Jun 14, 2017
2:00 PM
UK
Jobless claims change
% Change
May
19.40
7:30 AM
China
Industrial Production (YoY)
% Change
May
6.50
Source: Bloomberg, Angel Research
Market Outlook
May 30, 2017
Macro watch
Exhibit 1: Quarterly GDP trends
Exhibit 2: IIP trends
(%)
(%)
8.6
9.0
8.3
8.4
10.0
8.9
7.7
7.8
9.0
8.0
8.0
7.4
7.2
8.0
6.9
7.0
6.8
7.0
7.0
5.7
5.7
6.0
6.0
5.2
4.9
4.9
6.0
5.6
5.0
3.8
4.0
5.0
2.6
2.7
3.0
1.9
4.0
2.0
1.0
3.0
-
Source: CSO, Angel Research
Source: MOSPI, Angel Research
Exhibit 3: Monthly CPI inflation trends
Exhibit 4: Manufacturing and services PMI
56.0
Mfg. PMI
Services PMI
(%)
7.0
54.0
6.1
5.8
5.8
6.0
5.1
52.0
5.0
4.3
4.2
3.9
50.0
3.6
3.7
4.0
3.4
3.2
3.0
48.0
3.0
46.0
2.0
1.0
44.0
-
42.0
Source: MOSPI, Angel Research
Source: Market, Angel Research; Note: Level above 50 indicates expansion
Exhibit 5: Exports and imports growth trends
Exhibit 6: Key policy rates
(%)
Exports yoy growth
Imports yoy growth
(%)
Repo rate
Reverse Repo rate
CRR
60.0
7.00
50.0
6.50
40.0
6.00
30.0
5.50
20.0
5.00
10.0
4.50
0.0
4.00
(10.0)
(20.0)
3.50
(30.0)
3.00
Source: Bloomberg, Angel Research
Source: RBI, Angel Research
Market Outlook
May 30, 2017
Global watch
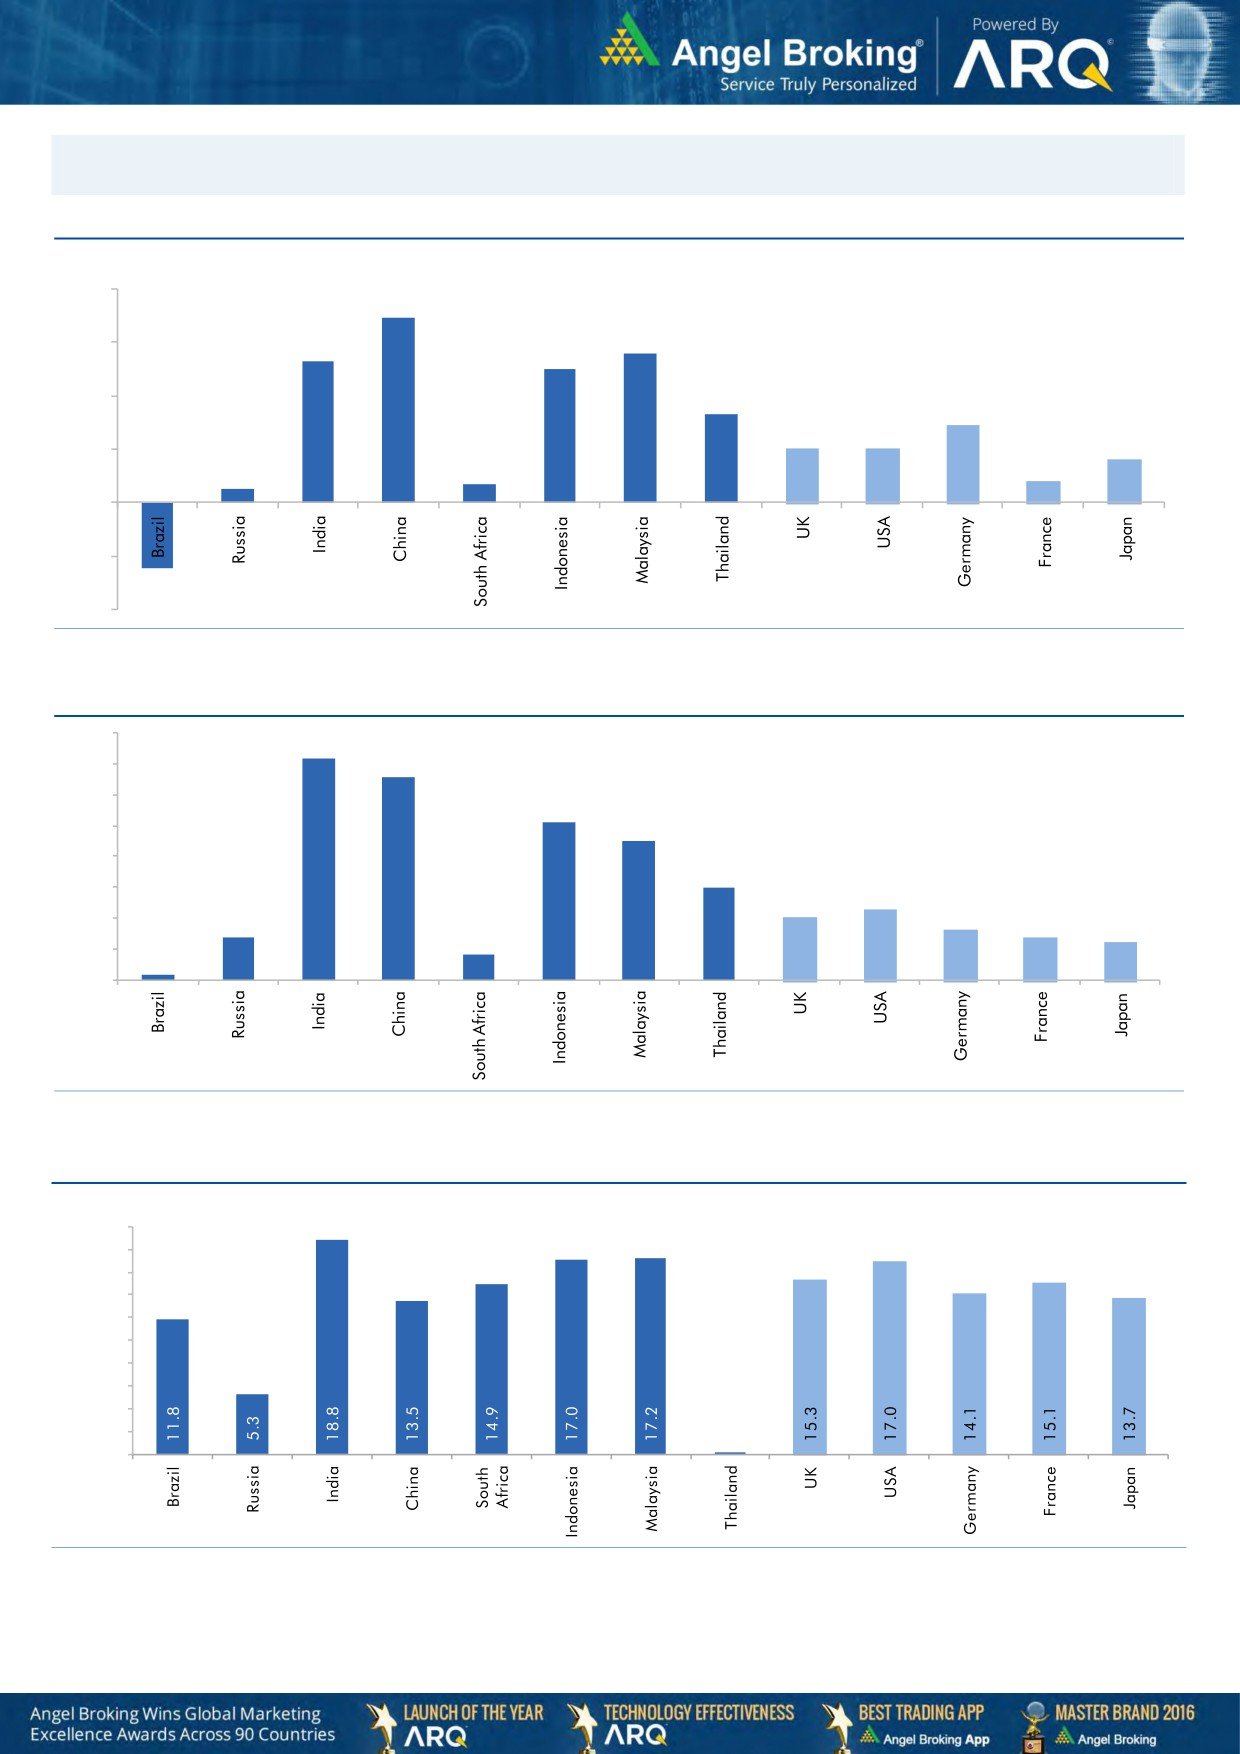
Exhibit 1: Latest quarterly GDP Growth (%, yoy) across select developing and developed countries
(%)
8.0
6.9
5.6
6.0
5.3
5.0
0.7
4.0
3.3
2.9
2.0
2.0
0.5
2.0
1.6
0.8
-
(2.0)
(2.5)
(4.0)
Source: Bloomberg, Angel Research
Exhibit 2: 2016 GDP Growth projection by IMF (%, yoy) across select developing and developed countries
(%)
7.2
7.0
6.6
6.0
5.1
5.0
4.5
4.0
3.0
3.0
2.3
2.0
1.4
1.6
2.0
1.4
1.2
0.2
0.8
1.0
-
Source: IMF, Angel Research
Exhibit 3: One year forward P-E ratio across select developing and developed countries
(x)
20.0
18.0
16.0
14.0
12.0
10.0
8.0
6.0
4.0
2.0
-
Source: IMF, Angel Research
Market Outlook
May 30, 2017
Exhibit 4: Relative performance of indices across globe
Returns (%)
Country
Name of index
Closing price
1M
3M
1YR
Brazil
Bovespa
63,761
(1.7)
(7.7)
28.9
Russia
Micex
1,941
(2.0)
(8.8)
2.2
India
Nifty
9,605
2.7
7.8
24.0
China
Shanghai Composite
3,108
(0.8)
(4.6)
9.1
South Africa
Top 40
47,534
2.2
4.3
(0.4)
Mexico
Mexbol
49,450
(0.2)
4.8
7.5
Indonesia
LQ45
954
1.6
7.6
18.0
Malaysia
KLCI
1,765
(0.1)
3.9
8.4
Thailand
SET 50
992
(0.2)
1.1
12.2
USA
Dow Jones
21,083
0.5
1.2
17.9
UK
FTSE
7,518
3.7
3.4
21.1
Japan
Nikkei
19,683
4.3
1.6
17.6
Germany
DAX
12,629
1.3
5.7
25.0
France
CAC
5,332
0.8
9.0
20.6
Source: Bloomberg, Angel Research
Stock Watch
May 30, 2017
Company Name
Reco
CMP
Target
Mkt Cap
Sales ( Čcr )
OPM(%)
EPS (Č)
PER(x)
P/BV(x)
RoE(%)
EV/Sales(x)
(Č)
Price ( Č)
( Č cr )
FY17E
FY18E
FY17E
FY18E
FY17E
FY18E
FY17E
FY18E
FY17E
FY18E
FY17E
FY18E
FY17E
FY18E
Agri / Agri Chemical
Rallis
Neutral
237
-
4,605
1,937
2,164
13.3
14.3
9.0
11.0
26.3
21.5
4.6
4.0
18.4
19.8
2.4
2.1
United Phosphorus
Neutral
847
-
43,018
15,176
17,604
18.5
18.5
37.4
44.6
22.6
19.0
4.4
3.7
21.4
21.2
2.9
2.5
Auto & Auto Ancillary
Amara Raja Batteries
Buy
857
1,009
14,642
5,305
6,100
16.0
16.3
28.4
34.0
30.2
25.2
5.8
4.9
19.3
19.3
2.8
2.4
Apollo Tyres
Neutral
225
-
11,451
12,877
14,504
14.3
13.9
21.4
23.0
10.5
9.8
1.6
1.4
16.4
15.2
1.1
1.0
Ashok Leyland
Buy
92
111
26,054
20,021
21,915
11.6
11.9
4.5
5.3
20.3
17.2
4.1
3.7
20.6
21.5
1.2
1.1
Bajaj Auto
Neutral
2,834
-
82,018
25,093
27,891
19.5
19.2
143.9
162.5
19.7
17.4
5.5
4.8
30.3
29.4
3.0
2.6
Bharat Forge
Neutral
1,135
-
26,416
7,726
8,713
20.5
21.2
35.3
42.7
32.2
26.6
5.9
5.4
18.9
20.1
3.5
3.0
Ceat
Neutral
1,668
-
6,746
7,524
8,624
13.0
12.7
131.1
144.3
12.7
11.6
2.3
2.0
19.8
18.6
1.0
0.9
Eicher Motors
Neutral
28,172
-
76,690
16,583
20,447
17.5
18.0
598.0
745.2
47.1
37.8
16.1
12.3
41.2
38.3
4.5
3.5
Exide Industries
Neutral
228
-
19,401
7,439
8,307
15.0
15.0
8.1
9.3
28.2
24.5
3.9
3.5
14.3
16.7
2.2
2.0
Gabriel India
Neutral
128
-
1,842
1,544
1,715
9.0
9.3
5.4
6.3
23.7
20.4
4.5
4.0
18.9
19.5
1.1
1.0
Hero Motocorp
Neutral
3,668
-
73,239
28,083
30,096
15.3
15.7
171.8
187.0
21.3
19.6
7.5
6.3
30.1
27.9
2.4
2.2
Indag Rubber
Neutral
207
-
544
286
326
19.8
16.8
11.7
13.3
17.7
15.5
3.0
2.8
17.8
17.1
1.6
1.4
Jamna Auto Industries
Neutral
245
-
1,950
1,486
1,620
9.8
9.9
15.0
17.2
16.3
14.2
3.6
3.0
21.8
21.3
1.4
1.3
JK Tyres
Neutral
163
-
3,696
7,455
8,056
15.0
15.0
21.8
24.5
7.5
6.7
1.6
1.3
22.8
21.3
0.6
0.5
L G Balakrishnan & Bros Neutral
696
-
1,092
1,302
1,432
11.6
11.9
43.7
53.0
15.9
13.1
2.3
2.0
13.8
14.2
0.9
0.8
Mahindra and Mahindra Neutral
1,351
-
83,906
46,534
53,077
11.6
11.7
67.3
78.1
20.1
17.3
3.3
2.9
15.4
15.8
1.8
1.5
Maruti
Neutral
7,134
-
215,490
67,822
83,288
16.0
16.4
253.8
312.4
28.1
22.8
6.5
5.2
23.0
22.9
2.8
2.2
Minda Industries
Neutral
607
-
5,247
2,728
3,042
9.0
9.1
68.2
86.2
8.9
7.0
2.0
1.6
23.8
24.3
2.0
1.7
Motherson Sumi
Neutral
449
-
62,977
45,896
53,687
7.8
8.3
13.0
16.1
34.4
27.9
11.1
8.8
34.7
35.4
1.4
1.2
Rane Brake Lining
Neutral
1,070
-
847
511
562
11.3
11.5
28.1
30.9
38.1
34.6
5.8
5.3
15.3
15.0
1.8
1.6
Setco Automotive
Neutral
41
-
552
741
837
13.0
13.0
15.2
17.0
2.7
2.4
0.4
0.4
15.8
16.3
1.1
1.0
Subros
Neutral
244
-
1,463
1,488
1,681
11.7
11.9
6.4
7.2
38.1
34.0
4.0
3.7
10.8
11.4
1.2
1.1
Swaraj Engines
Neutral
1,798
-
2,233
660
810
15.2
16.4
54.5
72.8
33.0
24.7
10.3
9.3
31.5
39.2
3.2
2.6
Tata Motors
Neutral
480
-
138,708
300,209
338,549
8.9
8.4
42.7
54.3
11.3
8.9
1.8
1.5
15.6
17.2
0.6
0.5
TVS Motor
Neutral
534
-
25,365
13,390
15,948
6.9
7.1
12.8
16.5
41.8
32.3
10.4
8.2
26.3
27.2
1.9
1.6
Capital Goods
ACE
Neutral
63
-
619
709
814
4.1
4.6
1.4
2.1
44.7
29.8
1.8
1.7
4.4
6.0
1.0
0.9
BEML
Neutral
1,180
-
4,914
3,451
4,055
6.3
9.2
31.4
57.9
37.6
20.4
2.3
2.1
6.3
10.9
1.5
1.3
BGR Energy
Neutral
156
-
1,126
16,567
33,848
6.0
5.6
7.8
5.9
20.0
26.5
1.1
1.1
4.7
4.2
0.2
0.1
Stock Watch
May 30, 2017
Company Name
Reco
CMP
Target
Mkt Cap
Sales ( Čcr )
OPM(%)
EPS (Č)
PER(x)
P/BV(x)
RoE(%)
EV/Sales(x)
(Č)
Price ( Č)
( Č cr )
FY17E
FY18E
FY17E
FY18E
FY17E
FY18E
FY17E
FY18E
FY17E
FY18E
FY17E
FY18E
FY17E
FY18E
Capital Goods
Bharat Electronics
Neutral
173
-
38,541
8,137
9,169
16.8
17.2
58.7
62.5
2.9
2.8
0.5
0.4
44.6
46.3
3.7
3.3
BHEL
Neutral
153
-
37,522
28,797
34,742
-
2.8
2.3
6.9
66.7
22.2
1.1
1.1
1.3
4.8
1.0
0.7
Blue Star
Buy
635
760
6,075
4,283
5,077
5.9
7.3
14.9
22.1
42.7
28.7
8.3
7.0
20.4
26.4
1.5
1.2
CG Power and Industrial
Neutral
79
-
4,945
5,777
6,120
5.9
7.0
3.3
4.5
23.9
17.5
1.1
1.0
4.4
5.9
0.8
0.7
Solutions
Greaves Cotton
Neutral
151
-
3,696
1,755
1,881
16.8
16.9
7.8
8.5
19.4
17.8
3.9
3.6
20.6
20.9
1.8
1.6
Inox Wind
Neutral
139
-
3,079
5,605
6,267
15.7
16.4
24.8
30.0
5.6
4.6
1.6
1.2
25.9
24.4
0.6
0.5
KEC International
Neutral
252
-
6,466
9,294
10,186
7.9
8.1
9.9
11.9
25.4
21.1
3.7
3.2
15.6
16.3
0.9
0.8
KEI Industries
Accumulate
213
239
1,657
2,682
3,058
10.4
10.0
11.7
12.8
18.2
16.6
3.6
3.0
20.1
18.2
0.8
0.7
Thermax
Neutral
999
-
11,899
5,421
5,940
7.3
7.3
25.7
30.2
38.9
33.1
4.7
4.3
12.2
13.1
2.1
1.9
VATech Wabag
Neutral
655
-
3,574
3,136
3,845
8.9
9.1
26.0
35.9
25.2
18.2
3.2
2.7
13.4
15.9
1.0
0.8
Voltas
Neutral
485
-
16,041
6,511
7,514
7.9
8.7
12.9
16.3
37.6
29.7
6.8
5.9
16.7
18.5
2.2
1.9
Cement
ACC
Neutral
1,623
-
30,477
11,225
13,172
13.2
16.9
44.5
75.5
36.5
21.5
3.5
3.2
11.2
14.2
2.7
2.3
Ambuja Cements
Neutral
240
-
47,685
9,350
10,979
18.2
22.5
5.8
9.5
41.4
25.3
3.5
3.1
10.2
12.5
5.1
4.3
India Cements
Neutral
188
-
5,789
4,364
4,997
18.5
19.2
7.9
11.3
23.9
16.7
1.7
1.7
8.0
8.5
2.1
1.8
J K Lakshmi Cement
Neutral
497
-
5,848
2,913
3,412
14.5
19.5
7.5
22.5
66.3
22.1
4.1
3.4
12.5
18.0
2.6
2.2
JK Cement
Neutral
1,089
-
7,614
4,398
5,173
15.5
17.5
31.2
55.5
34.9
19.6
4.2
3.6
12.0
15.5
2.3
1.9
Orient Cement
Neutral
150
-
3,077
2,114
2,558
18.5
20.5
8.1
11.3
18.5
13.3
2.7
2.3
9.0
14.0
2.1
1.6
UltraTech Cement
Neutral
4,070
-
111,714
25,768
30,385
21.0
23.5
111.0
160.0
36.7
25.4
4.7
4.1
13.5
15.8
4.4
3.7
Construction
Engineers India
Neutral
154
-
10,391
1,725
1,935
16.0
19.1
11.4
13.9
13.5
11.1
1.9
1.8
13.4
15.3
5.0
4.4
Gujarat Pipavav Port
Neutral
148
-
7,167
705
788
52.2
51.7
5.0
5.6
29.7
26.5
2.9
2.6
11.2
11.2
9.8
8.3
ITNL
Neutral
104
-
3,406
8,946
10,017
31.0
31.6
8.1
9.1
12.8
11.4
0.5
0.5
4.2
5.0
3.7
3.4
KNR Constructions
Neutral
199
-
2,798
1,385
1,673
14.7
14.0
41.2
48.5
4.8
4.1
0.9
0.8
14.9
15.2
2.1
1.7
Larsen & Toubro
Neutral
1,788
-
166,869
111,017
124,908
11.0
11.0
61.1
66.7
29.3
26.8
3.5
3.3
13.1
12.9
2.5
2.3
MEP Infra
Neutral
72
-
1,168
1,877
1,943
30.6
29.8
3.0
4.2
24.0
17.1
11.6
7.8
0.6
0.6
2.0
1.8
Nagarjuna Const.
Neutral
85
-
4,731
8,842
9,775
9.1
8.8
5.3
6.4
16.1
13.3
1.3
1.2
8.2
9.1
0.7
0.6
NBCC
Neutral
195
-
17,541
7,428
9,549
7.9
8.6
8.2
11.0
23.8
17.7
1.2
0.9
28.2
28.7
2.1
1.6
PNC Infratech
Neutral
143
-
3,667
2,350
2,904
13.1
13.2
9.0
8.8
15.9
16.2
0.6
0.5
15.9
13.9
1.7
1.4
Power Mech Projects
Neutral
588
-
865
1,801
2,219
12.7
14.6
72.1
113.9
8.2
5.2
1.5
1.3
16.8
11.9
0.5
0.4
Sadbhav Engineering
Neutral
315
-
5,397
3,598
4,140
10.3
10.6
9.0
11.9
35.0
26.4
3.7
3.2
9.9
11.9
1.8
1.5
Stock Watch
May 30, 2017
Company Name
Reco
CMP
Target
Mkt Cap
Sales ( Čcr )
OPM(%)
EPS (Č)
PER(x)
P/BV(x)
RoE(%)
EV/Sales(x)
(Č)
Price ( Č)
( Č cr )
FY17E
FY18E
FY17E
FY18E
FY17E
FY18E
FY17E
FY18E
FY17E
FY18E
FY17E
FY18E
FY17E
FY18E
Construction
Simplex Infra
Neutral
423
-
2,090
6,829
7,954
10.5
10.5
31.4
37.4
13.5
11.3
1.4
1.3
9.9
13.4
0.7
0.6
SIPL
Neutral
105
-
3,700
1,036
1,252
65.5
66.2
(8.4)
(5.6)
3.9
4.5
(22.8)
(15.9)
11.8
9.8
Financials
Axis Bank
Accumulate
506
580
121,263
46,932
53,575
3.5
3.4
32.4
44.6
15.6
11.3
2.0
1.8
13.6
16.5
-
-
Bank of Baroda
Neutral
174
-
40,104
19,980
23,178
1.8
1.8
11.5
17.3
15.1
10.1
1.7
1.4
8.3
10.1
-
-
Can Fin Homes
Neutral
2,620
-
6,975
420
526
3.5
3.5
86.5
107.8
30.3
24.3
6.5
5.3
23.6
24.1
-
-
Canara Bank
Neutral
351
-
20,962
15,225
16,836
1.8
1.8
14.5
28.0
24.2
12.5
1.7
1.4
5.8
8.5
-
-
Cholamandalam Inv. &
Buy
1,032
1,230
16,129
2,012
2,317
6.3
6.3
42.7
53.6
24.2
19.3
3.8
3.3
16.9
18.3
-
-
Fin. Co.
Dewan Housing Finance Buy
411
520
12,877
2,225
2,688
2.9
2.9
29.7
34.6
13.8
11.9
2.2
1.5
16.1
14.8
-
-
Equitas Holdings
Buy
149
235
5,050
939
1,281
11.7
11.5
5.8
8.2
25.8
18.2
2.2
2.0
10.9
11.5
-
-
Federal Bank
Accumulate
109
125
18,760
8,259
8,995
3.0
3.0
4.3
5.6
25.3
19.4
2.1
2.0
8.5
10.1
-
-
HDFC
Neutral
1,599
-
254,109
11,475
13,450
3.4
3.4
45.3
52.5
35.3
30.5
6.8
6.0
20.2
20.5
-
-
HDFC Bank
Neutral
1,632
-
418,606
46,097
55,433
4.5
4.5
58.4
68.0
28.0
24.0
4.9
4.1
18.8
18.6
-
-
ICICI Bank
Neutral
315
-
183,391
42,800
44,686
3.1
3.3
18.0
21.9
17.5
14.4
2.4
2.2
11.1
12.3
-
-
Karur Vysya Bank
Buy
117
140
7,086
5,640
6,030
3.3
3.2
8.9
10.0
13.2
11.7
1.4
1.3
11.2
11.4
-
-
Lakshmi Vilas Bank
Neutral
184
-
3,522
3,339
3,799
2.7
2.8
11.0
14.0
16.7
13.1
1.7
1.6
11.2
12.7
-
-
LIC Housing Finance
Neutral
702
-
35,417
3,712
4,293
2.6
2.5
39.0
46.0
18.0
15.3
3.4
2.9
19.9
20.1
-
-
Punjab Natl.Bank
Neutral
145
-
30,941
23,532
23,595
2.3
2.4
6.8
12.6
21.4
11.5
3.3
2.4
3.3
6.5
-
-
RBL Bank
Neutral
508
-
19,098
1,783
2,309
2.6
2.6
12.7
16.4
40.0
31.0
4.4
3.9
12.8
13.3
-
-
Repco Home Finance
Accumulate
760
825
4,756
388
457
4.5
4.2
30.0
38.0
25.3
20.0
4.2
3.5
18.0
19.2
-
-
South Ind.Bank
Neutral
27
-
4,851
6,435
7,578
2.5
2.5
2.7
3.1
10.0
8.7
1.3
1.1
10.1
11.2
-
-
St Bk of India
Neutral
284
-
230,644
88,650
98,335
2.6
2.6
13.5
18.8
21.1
15.1
2.0
1.8
7.0
8.5
-
-
Union Bank
Neutral
153
-
10,545
13,450
14,925
2.3
2.3
25.5
34.5
6.0
4.5
0.9
0.8
7.5
10.2
-
-
Yes Bank
Neutral
1,441
-
65,832
8,978
11,281
3.3
3.4
74.0
90.0
19.5
16.0
3.7
3.1
17.0
17.2
-
-
FMCG
Akzo Nobel India
Neutral
1,806
-
8,663
2,955
3,309
13.3
13.7
57.2
69.3
31.6
26.1
10.3
8.7
32.7
33.3
2.7
2.4
Asian Paints
Neutral
1,145
-
109,843
17,128
18,978
16.8
16.4
19.1
20.7
60.0
55.3
20.9
19.7
34.8
35.5
6.3
5.7
Britannia
Accumulate
3,424
3,626
41,094
9,594
11,011
14.6
14.9
80.3
94.0
42.7
36.4
17.5
13.5
41.2
-
4.1
3.6
Colgate
Neutral
1,018
-
27,687
4,605
5,149
23.4
23.4
23.8
26.9
42.8
37.8
23.7
18.5
64.8
66.8
5.9
5.3
Dabur India
Accumulate
279
304
49,058
8,315
9,405
19.8
20.7
8.1
9.2
34.4
30.3
9.6
7.9
31.6
31.0
5.6
4.9
GlaxoSmith Con*
Neutral
5,322
-
22,382
4,350
4,823
21.2
21.4
179.2
196.5
29.7
27.1
7.9
6.7
27.1
26.8
4.5
4.0
Stock Watch
May 30, 2017
Company Name
Reco
CMP
Target
Mkt Cap
Sales ( Čcr )
OPM(%)
EPS (Č)
PER(x)
P/BV(x)
RoE(%)
EV/Sales(x)
(Č)
Price ( Č)
( Č cr )
FY17E FY18E
FY17E
FY18E
FY17E
FY18E
FY17E
FY18E
FY17E
FY18E
FY17E
FY18E
FY17E
FY18E
FMCG
Godrej Consumer
Neutral
1,828
-
62,274
10,235
11,428
18.4
18.6
41.1
44.2
44.5
41.4
9.9
8.3
24.9
24.8
6.2
5.5
HUL
Neutral
1,073
-
232,170
35,252
38,495
17.8
17.8
20.7
22.4
52.0
47.9
49.7
42.6
95.6
88.9
6.4
5.9
ITC
Neutral
316
-
383,857
40,059
44,439
38.3
39.2
9.0
10.1
35.2
31.2
9.8
8.6
27.8
27.5
9.1
8.2
Marico
Neutral
317
-
40,927
6,430
7,349
18.8
19.5
6.4
7.7
49.6
41.2
15.0
12.6
33.2
32.5
6.2
5.4
Nestle*
Neutral
6,614
-
63,773
10,073
11,807
20.7
21.5
124.8
154.2
53.0
42.9
21.8
19.6
34.8
36.7
6.1
5.2
Procter & Gamble
Neutral
7,494
-
24,327
2,939
3,342
23.2
23.0
146.2
163.7
51.3
45.8
13.0
10.8
25.3
23.5
7.8
6.8
Hygiene
Tata Global
Neutral
145
-
9,177
8,675
9,088
9.8
9.8
7.4
8.2
19.7
17.7
1.6
1.5
7.9
8.1
1.0
0.9
IT
HCL Tech^
Buy
863
1,014
123,156
46,723
52,342
22.1
20.9
60.0
62.8
14.4
13.7
3.6
3.1
25.3
22.4
2.4
2.0
Infosys
Buy
985
1,179
226,318
68,484
73,963
26.0
26.0
63.0
64.0
15.6
15.4
3.3
3.0
20.8
19.7
3.0
2.6
TCS
Neutral
2,572
-
506,696
117,966
127,403
27.5
27.6
134.3
144.5
19.2
17.8
5.7
5.3
29.8
29.7
3.9
3.7
Tech Mahindra
Buy
379
600
36,972
29,673
32,937
15.5
17.0
32.8
39.9
11.6
9.5
2.3
2.0
19.6
20.7
1.0
0.8
Wipro
Accumulate
534
570
130,011
55,421
58,536
20.3
20.3
35.1
36.5
15.2
14.6
2.6
2.3
19.2
14.6
1.8
1.5
Media
D B Corp
Neutral
364
-
6,697
2,297
2,590
27.4
28.2
21.0
23.4
17.3
15.6
4.1
3.5
23.7
23.1
2.7
2.3
Hindustan Media
Neutral
274
-
2,007
1,016
1,138
24.3
25.2
27.3
30.1
10.0
9.1
1.9
1.7
16.2
15.8
1.3
1.1
Ventures
HT Media
Neutral
81
-
1,883
2,693
2,991
12.6
12.9
7.9
9.0
10.2
9.0
0.9
0.8
7.8
8.3
0.3
0.2
Jagran Prakashan
Buy
176
225
5,749
2,355
2,635
28.0
28.0
10.8
12.5
16.3
14.1
3.5
3.1
21.7
21.7
2.5
2.2
Sun TV Network
Neutral
781
-
30,776
2,850
3,265
70.1
71.0
26.2
30.4
29.8
25.7
7.6
6.7
24.3
25.6
10.4
8.9
TV Today Network
Buy
263
344
1,570
567
645
26.7
27.0
15.4
18.1
17.1
14.5
2.6
2.2
14.9
15.2
2.3
2.0
Metals & Mining
Coal India
Neutral
268
-
166,141
84,638
94,297
21.4
22.3
24.5
27.1
10.9
9.9
4.5
4.3
42.6
46.0
1.5
1.3
Hind. Zinc
Neutral
239
-
100,879
14,252
18,465
55.9
48.3
15.8
21.5
15.1
11.1
2.5
2.2
17.0
20.7
7.1
5.5
Hindalco
Neutral
201
-
45,159
107,899
112,095
7.4
8.2
9.2
13.0
21.9
15.5
1.1
1.0
4.8
6.6
0.9
0.9
JSW Steel
Neutral
196
-
47,329
53,201
58,779
16.1
16.2
130.6
153.7
1.5
1.3
0.2
0.2
14.0
14.4
1.7
1.4
NMDC
Neutral
113
-
35,879
6,643
7,284
44.4
47.7
7.1
7.7
16.0
14.7
1.4
1.4
8.8
9.2
3.2
2.8
SAIL
Neutral
59
-
24,244
47,528
53,738
(0.7)
2.1
(1.9)
2.6
22.6
0.6
0.6
(1.6)
3.9
1.4
1.2
Tata Steel
Neutral
508
-
49,318
121,374
121,856
7.2
8.4
18.6
34.3
27.3
14.8
1.7
1.6
6.1
10.1
1.0
1.0
Vedanta
Neutral
244
-
90,774
71,744
81,944
19.2
21.7
13.4
20.1
18.2
12.2
1.6
1.4
8.4
11.3
1.7
1.3
Oil & Gas
GAIL
Neutral
399
-
67,424
56,220
65,198
9.3
10.1
27.1
33.3
14.7
12.0
1.3
1.3
9.3
10.7
1.4
1.2
Indian Oil Corp
Neutral
419
-
203,584
373,359
428,656
5.9
5.5
54.0
59.3
7.8
7.1
1.2
1.1
16.0
15.6
0.7
0.6
ONGC
Neutral
175
-
224,710
137,222
152,563
15.0
21.8
19.5
24.1
9.0
7.3
0.8
0.7
8.5
10.1
1.9
1.7
Stock Watch
May 30, 2017
Company Name
Reco
CMP
Target
Mkt Cap
Sales ( Čcr )
OPM(%)
EPS (Č)
PER(x)
P/BV(x)
RoE(%)
EV/Sales(x)
(Č)
Price ( Č)
( Č cr )
FY17E FY18E
FY17E
FY18E
FY17E
FY18E
FY17E
FY18E
FY17E
FY18E
FY17E
FY18E
FY17E
FY18E
Oil & Gas
Reliance Industries
Neutral
1,357
-
441,073
301,963
358,039
12.1
12.6
87.7
101.7
15.5
13.3
1.6
1.4
10.7
11.3
1.9
1.6
Pharmaceuticals
Alembic Pharma
Buy
533
648
10,048
3,101
3,966
19.7
20.5
21.4
25.5
24.9
20.9
5.3
4.3
23.0
22.8
3.2
2.4
Alkem Laboratories Ltd
Buy
1,820
2,257
21,763
6,065
7,009
18.7
20.0
80.2
92.0
22.7
19.8
5.1
4.3
22.5
21.6
3.5
3.1
Aurobindo Pharma
Buy
514
877
30,097
15,720
18,078
23.7
23.7
41.4
47.3
12.4
10.9
3.2
2.5
29.6
26.1
2.1
1.8
Aventis*
Neutral
4,007
-
9,227
2,206
2,508
16.6
16.8
128.9
139.9
31.1
28.6
5.3
4.2
21.6
23.5
4.0
3.3
Cadila Healthcare
Neutral
457
-
46,744
10,429
12,318
17.7
21.6
13.1
19.2
34.9
23.8
7.3
5.8
22.8
27.1
4.5
3.7
Cipla
Reduce
504
465
40,561
15,378
18,089
15.7
16.8
19.3
24.5
26.1
20.6
3.1
2.7
12.3
13.9
2.8
2.3
Dishman Pharma
Sell
301
143
4,859
1,718
1,890
22.7
22.8
9.5
11.3
31.7
26.6
3.1
2.8
10.1
10.9
3.3
2.9
Dr Reddy's
Neutral
2,425
-
40,174
14,081
15,937
16.1
18.6
72.6
105.9
33.4
22.9
3.3
3.0
9.6
13.6
3.1
2.7
GSK Pharma*
Neutral
2,330
-
19,738
2,927
3,290
11.8
16.2
34.4
49.6
67.7
47.0
9.8
10.2
13.9
21.3
6.5
5.9
Indoco Remedies
Buy
191
240
1,764
1,112
1,289
16.2
18.2
11.6
16.0
16.5
12.0
2.6
2.2
17.0
20.1
1.7
1.4
Ipca labs
Buy
490
613
6,185
3,258
3,747
12.8
15.3
12.1
19.2
40.5
25.5
2.5
2.3
6.4
9.5
2.0
1.8
Lupin
Buy
1,109
1,809
50,106
15,912
18,644
26.4
26.7
58.1
69.3
19.1
16.0
3.7
3.1
21.4
20.9
3.2
2.6
Natco Pharma
Accumulate
889
974
15,492
2,090
2,335
32.1
26.6
26.8
23.2
33.1
38.3
9.4
8.1
28.4
21.1
7.5
91.8
Sun Pharma
Buy
503
847
120,645
31,129
35,258
32.0
32.9
30.2
35.3
16.7
14.3
2.7
2.2
20.0
20.1
3.4
2.8
Power
NTPC
Neutral
156
-
128,918
86,605
95,545
17.5
20.8
11.8
13.4
13.3
11.7
1.3
1.3
10.5
11.1
2.8
2.8
Power Grid
Accumulate
208
223
109,052
25,315
29,193
88.2
88.7
14.2
17.2
14.7
12.2
2.2
2.0
15.2
16.1
9.0
8.0
Tata Power
Neutral
81
-
21,949
36,916
39,557
17.4
27.1
5.1
6.3
15.9
12.9
1.4
1.3
9.0
10.3
1.6
1.4
Real Estate
MLIFE
Buy
421
522
2,163
1,152
1,300
22.7
24.6
29.9
35.8
14.1
11.8
1.0
1.0
7.6
8.6
2.6
2.2
Prestige Estate
Neutral
229
-
8,584
4,707
5,105
25.2
26.0
10.3
13.0
22.2
17.6
1.8
1.7
10.3
10.2
3.0
2.7
Telecom
Bharti Airtel
Neutral
373
-
149,123
105,086
114,808
34.5
34.7
12.2
16.4
30.6
22.8
2.1
1.9
6.8
8.4
2.3
2.0
Idea Cellular
Neutral
79
-
28,522
40,133
43,731
37.2
37.1
6.4
6.5
12.4
12.2
1.0
1.0
8.2
7.6
1.7
1.5
zOthers
Abbott India
Neutral
4,009
-
8,519
3,153
3,583
14.1
14.4
152.2
182.7
26.3
21.9
129.3
110.5
25.6
26.1
2.4
2.1
Asian Granito
Accumulate
365
405
1,097
1,060
1,169
12.2
12.5
12.7
15.9
28.8
22.9
2.7
2.4
9.5
10.7
1.3
1.2
Bajaj Electricals
Accumulate
349
395
3,533
4,801
5,351
5.7
6.2
10.4
13.7
33.5
25.5
4.1
3.7
12.4
14.5
0.7
0.7
Banco Products (India)
Neutral
219
-
1,564
1,353
1,471
12.3
12.4
14.5
16.3
15.1
13.4
20.8
18.8
14.5
14.6
1.1
117.7
Coffee Day Enterprises
Neutral
248
-
5,118
2,964
3,260
20.5
21.2
4.7
8.0
-
31.0
2.9
2.6
5.5
8.5
2.1
1.9
Ltd
Competent Automobiles Neutral
208
-
133
1,137
1,256
3.1
2.7
28.0
23.6
7.4
8.8
40.0
36.1
14.3
11.5
0.1
0.1
Elecon Engineering
Neutral
64
-
717
1,482
1,660
13.7
14.5
3.9
5.8
16.4
11.0
3.9
3.5
7.8
10.9
0.8
0.7
Stock Watch
May 30, 2017
Company Name
Reco
CMP
Target
Mkt Cap
Sales ( Čcr )
OPM(%)
EPS (Č)
PER(x)
P/BV(x)
RoE(%)
EV/Sales(x)
(Č)
Price ( Č)
( Č cr )
FY17E
FY18E
FY17E
FY18E
FY17E
FY18E
FY17E
FY18E
FY17E
FY18E
FY17E
FY18E
FY17E
FY18E
zOthers
Finolex Cables
Neutral
513
-
7,840
2,883
3,115
12.0
12.1
14.2
18.6
36.1
27.6
19.2
16.8
15.8
14.6
2.4
2.2
Garware Wall Ropes
Neutral
779
-
1,705
863
928
15.1
15.2
36.4
39.4
21.4
19.8
3.9
3.3
17.5
15.9
1.9
1.7
Goodyear India*
Neutral
814
-
1,877
1,598
1,704
10.4
10.2
49.4
52.6
16.5
15.5
76.1
66.7
18.2
17.0
0.9
121.5
Hitachi
Neutral
1,915
-
5,206
2,081
2,433
8.8
8.9
33.4
39.9
57.3
48.0
46.3
38.5
22.1
21.4
2.5
2.1
HSIL
Neutral
347
-
2,505
2,384
2,515
15.8
16.3
15.3
19.4
22.7
17.9
22.5
19.4
7.8
9.3
1.2
1.1
Interglobe Aviation
Neutral
1,077
-
38,936
21,122
26,005
14.5
27.6
110.7
132.1
9.7
8.2
58.2
41.6
168.5
201.1
1.8
1.4
Jyothy Laboratories
Neutral
367
-
6,674
1,440
2,052
11.5
13.0
8.5
10.0
43.2
36.7
10.5
9.7
18.6
19.3
4.9
3.4
Kirloskar Engines India
Neutral
383
-
5,532
2,554
2,800
9.9
10.0
10.5
12.1
36.4
31.6
15.2
14.4
10.7
11.7
1.8
1.6
Ltd
Linc Pen & Plastics
Neutral
267
-
395
382
420
9.3
9.5
13.5
15.7
19.8
17.0
3.4
2.9
17.1
17.3
1.1
1.0
M M Forgings
Neutral
621
-
750
546
608
20.4
20.7
41.3
48.7
15.1
12.8
85.1
75.3
16.6
17.0
1.2
1.1
Manpasand Bever.
Neutral
822
-
4,700
836
1,087
19.6
19.4
16.9
23.8
48.6
34.5
5.8
5.1
12.0
14.8
5.4
4.0
Mirza International
Neutral
139
-
1,673
963
1,069
17.2
18.0
6.1
7.5
22.7
18.5
3.5
3.0
15.0
15.7
2.0
1.7
MT Educare
Neutral
64
-
254
366
417
17.7
18.2
9.4
10.8
6.8
5.9
1.5
1.3
22.2
22.3
0.6
0.5
Narayana Hrudaya
Neutral
296
-
6,044
1,873
2,166
11.5
11.7
2.6
4.0
111.8
74.6
6.9
6.2
6.1
8.3
3.3
2.9
Navkar Corporation
Buy
210
265
2,998
369
561
42.9
42.3
6.9
11.5
30.4
18.3
2.1
1.9
7.4
10.5
9.1
6.0
Navneet Education
Neutral
176
-
4,114
1,062
1,147
24.0
24.0
6.1
6.6
28.9
26.6
5.9
5.3
20.6
19.8
4.0
3.7
Nilkamal
Neutral
1,981
-
2,957
1,995
2,165
10.7
10.4
69.8
80.6
28.4
24.6
113.2
98.4
16.6
16.5
1.5
1.3
Page Industries
Neutral
14,260
-
15,905
2,450
3,124
20.1
17.6
299.0
310.0
47.7
46.0
317.6
242.4
47.1
87.5
6.5
5.2
Parag Milk Foods
Neutral
249
-
2,092
1,919
2,231
9.3
9.6
9.5
12.9
26.3
19.2
4.1
3.4
15.5
17.5
1.2
1.1
Quick Heal
Neutral
205
-
1,441
408
495
27.3
27.0
7.7
8.8
26.5
23.4
2.5
2.5
9.3
10.6
2.7
2.2
Radico Khaitan
Buy
119
147
1,589
1,667
1,824
13.0
13.2
6.7
8.2
18.0
14.6
1.6
1.5
9.0
10.2
1.3
1.2
Relaxo Footwears
Neutral
467
-
5,605
2,085
2,469
9.2
8.2
7.6
8.0
61.7
58.7
23.9
20.4
17.9
18.8
2.8
2.4
S H Kelkar & Co.
Neutral
285
-
4,125
1,036
1,160
15.1
15.0
6.1
7.2
46.7
39.7
5.0
4.6
10.7
11.5
3.9
3.4
Siyaram Silk Mills
Neutral
1,881
-
1,763
1,652
1,857
11.6
11.7
92.4
110.1
20.3
17.1
3.0
2.6
14.7
15.2
1.3
1.1
Styrolution ABS India*
Neutral
770
-
1,355
1,440
1,537
9.2
9.0
40.6
42.6
19.0
18.1
48.4
44.0
12.3
11.6
0.9
0.8
Surya Roshni
Neutral
262
-
1,149
3,342
3,625
7.8
7.5
17.3
19.8
15.2
13.3
28.8
23.1
10.5
10.8
0.6
0.5
Team Lease Serv.
Neutral
1,155
-
1,975
3,229
4,001
1.5
1.8
22.8
32.8
50.7
35.2
5.4
4.7
10.7
13.4
0.5
0.4
The Byke Hospitality
Neutral
194
-
780
287
384
20.5
20.5
7.6
10.7
25.6
18.2
5.3
4.3
20.7
23.5
2.7
2.0
Transport Corporation of
Neutral
253
-
1,937
2,671
2,911
8.5
8.8
13.9
15.7
18.3
16.2
2.5
2.2
13.7
13.8
0.8
0.8
India
Stock Watch
May 30, 2017
Company Name
Reco
CMP
Target Mkt Cap
Sales ( Čcr )
OPM(%)
EPS (Č)
PER(x)
P/BV(x)
RoE(%)
EV/Sales(x)
(Č)
Price ( Č)
( Č cr )
FY17E FY18E FY17E FY18E FY17E FY18E FY17E FY18E FY17E FY18E FY17E FY18E FY17E FY18E
zOthers
TVS Srichakra
Neutral
3,928
-
3,007
2,304
2,614
13.7
13.8
231.1
266.6
17.0
14.7
441.3
347.5
33.9
29.3
1.3
1.1
UFO Moviez
Neutral
376
-
1,037
619
685
33.2
33.4
30.0
34.9
12.5
10.8
1.7
1.5
13.8
13.9
1.4
1.1
Visaka Industries
Neutral
386
-
613
1,051
1,138
10.3
10.4
21.0
23.1
18.4
16.7
49.5
46.3
9.0
9.2
0.8
0.8
VRL Logistics
Neutral
320
-
2,919
1,902
2,119
16.7
16.6
14.6
16.8
22.0
19.0
4.8
4.2
21.9
22.2
1.7
1.4
Wonderla Holidays
Neutral
375
-
2,120
287
355
38.0
40.0
11.3
14.2
33.2
26.4
4.8
4.2
21.4
23.9
7.1
5.7
VIP Industries
Buy
190
218
2,679
1,270
1,450
10.4
10.4
5.6
6.5
33.9
29.2
7.0
6.1
20.7
21.1
2.1
1.8
Navin Fluorine
Buy
2,968
3,650
2,906
789
945
21.1
22.4
120.1
143.4
24.7
20.7
4.0
3.4
17.8
18.5
3.6
2.9
Source: Company, Angel Research; Note: *December year end; #September year end; &October year end; Price as on May 29, 2017
Market Outlook
May 30, 2017
Research Team Tel: 022 - 39357800
DISCLAIMER
Angel Broking Private Limited (hereinafter referred to as “Angel”) is a registered Member of National Stock Exchange of India
Limited,Bombay Stock Exchange Limited and Metropolitan Stock Exchange Limited. It is also registered as a Depository Participant with
CDSL and Portfolio Manager with SEBI. It also has registration with AMFI as a Mutual Fund Distributor. Angel Broking Private Limited is a
registered entity with SEBI for Research Analyst in terms of SEBI (Research Analyst) Regulations, 2014 vide registration number
INH000000164. Angel or its associates has not been debarred/ suspended by SEBI or any other regulatory authority for accessing
/dealing in securities Market. Angel or its associates/analyst has not received any compensation / managed or
co-managed public offering of securities of the company covered by Analyst during the past twelve months.
This document is solely for the personal information of the recipient, and must not be singularly used as the basis of any investment
decision. Nothing in this document should be construed as investment or financial advice. Each recipient of this document should make
such investigations as they deem necessary to arrive at an independent evaluation of an investment in the securities of the companies
referred to in this document (including the merits and risks involved), and should consult their own advisors to determine the merits and
risks of such an investment.
Reports based on technical and derivative analysis center on studying charts of a stock's price movement, outstanding positions and
trading volume, as opposed to focusing on a company's fundamentals and, as such, may not match with a report on a company's
fundamentals. Investors are advised to refer the Fundamental and Technical Research Reports available on our website to evaluate the
contrary view, if any.
The information in this document has been printed on the basis of publicly available information, internal data and other reliable
sources believed to be true, but we do not represent that it is accurate or complete and it should not be relied on as such, as this
document is for general guidance only. Angel Broking Pvt. Limited or any of its affiliates/ group companies shall not be in any way
responsible for any loss or damage that may arise to any person from any inadvertent error in the information contained in this report.
Angel Broking Pvt. Limited has not independently verified all the information contained within this document. Accordingly, we cannot
testify, nor make any representation or warranty, express or implied, to the accuracy, contents or data contained within this document.
While Angel Broking Pvt. Limited endeavors to update on a reasonable basis the information discussed in this material, there may be
regulatory, compliance, or other reasons that prevent us from doing so.
This document is being supplied to you solely for your information, and its contents, information or data may not be reproduced,
redistributed or passed on, directly or indirectly.
Neither Angel Broking Pvt. Limited, nor its directors, employees or affiliates shall be liable for any loss or damage that may arise from
or in connection with the use of this information.